
Technology
Monitoring
High-dimensional data collection and alerting for cloud-native infrastructure.
Monitoring is the operational heartbeat of any production system. We use tools like Prometheus and Grafana to transform raw metrics into actionable intelligence. By scraping time-series data (CPU usage, request latency, or error rates) every 15 seconds, we gain a granular view of cluster health. This setup allows us to define precise alerting rules (e.g., firing a PagerDuty notification if 95th percentile latency exceeds 300ms) so we can kill bottlenecks before they impact users. It is about moving from reactive guesswork to proactive, data-driven engineering.
What builders pair with Monitoring
Projects using both technologies. Select a pairing to see a project.
7 more pairings
Pairing: Agent
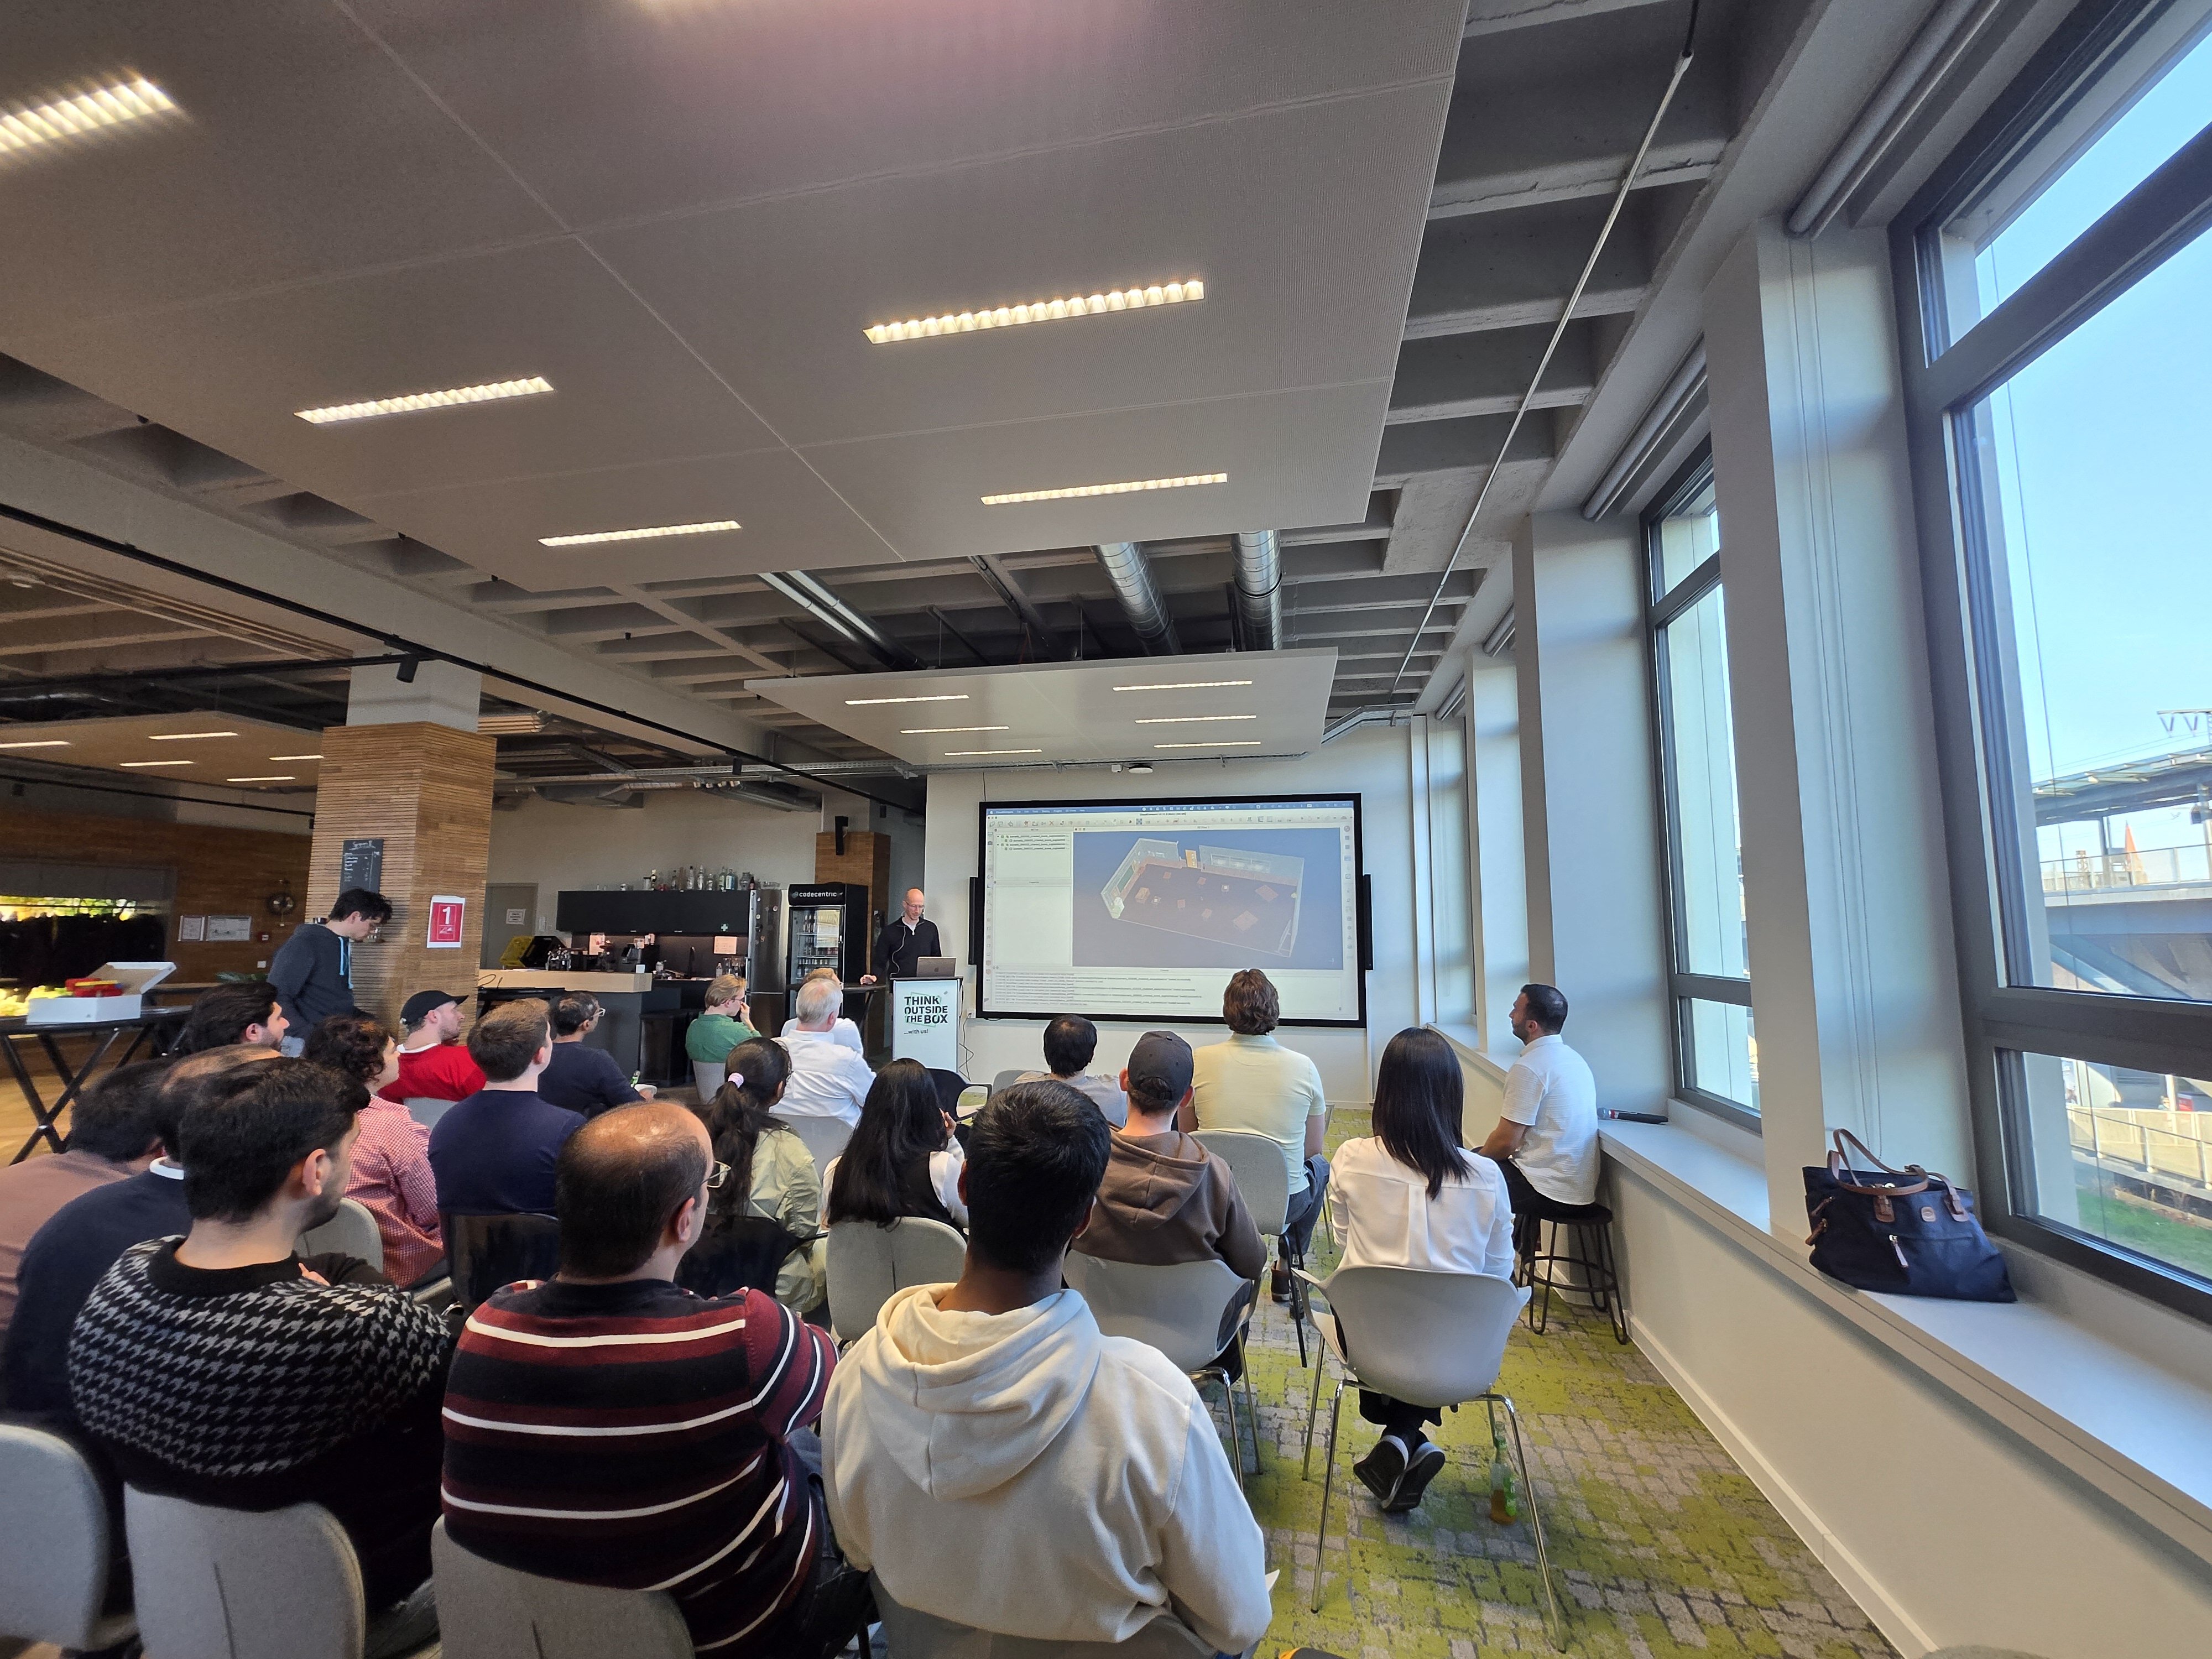
ibaAgent: Agentic time-series analysis.
Pairing: Alerts
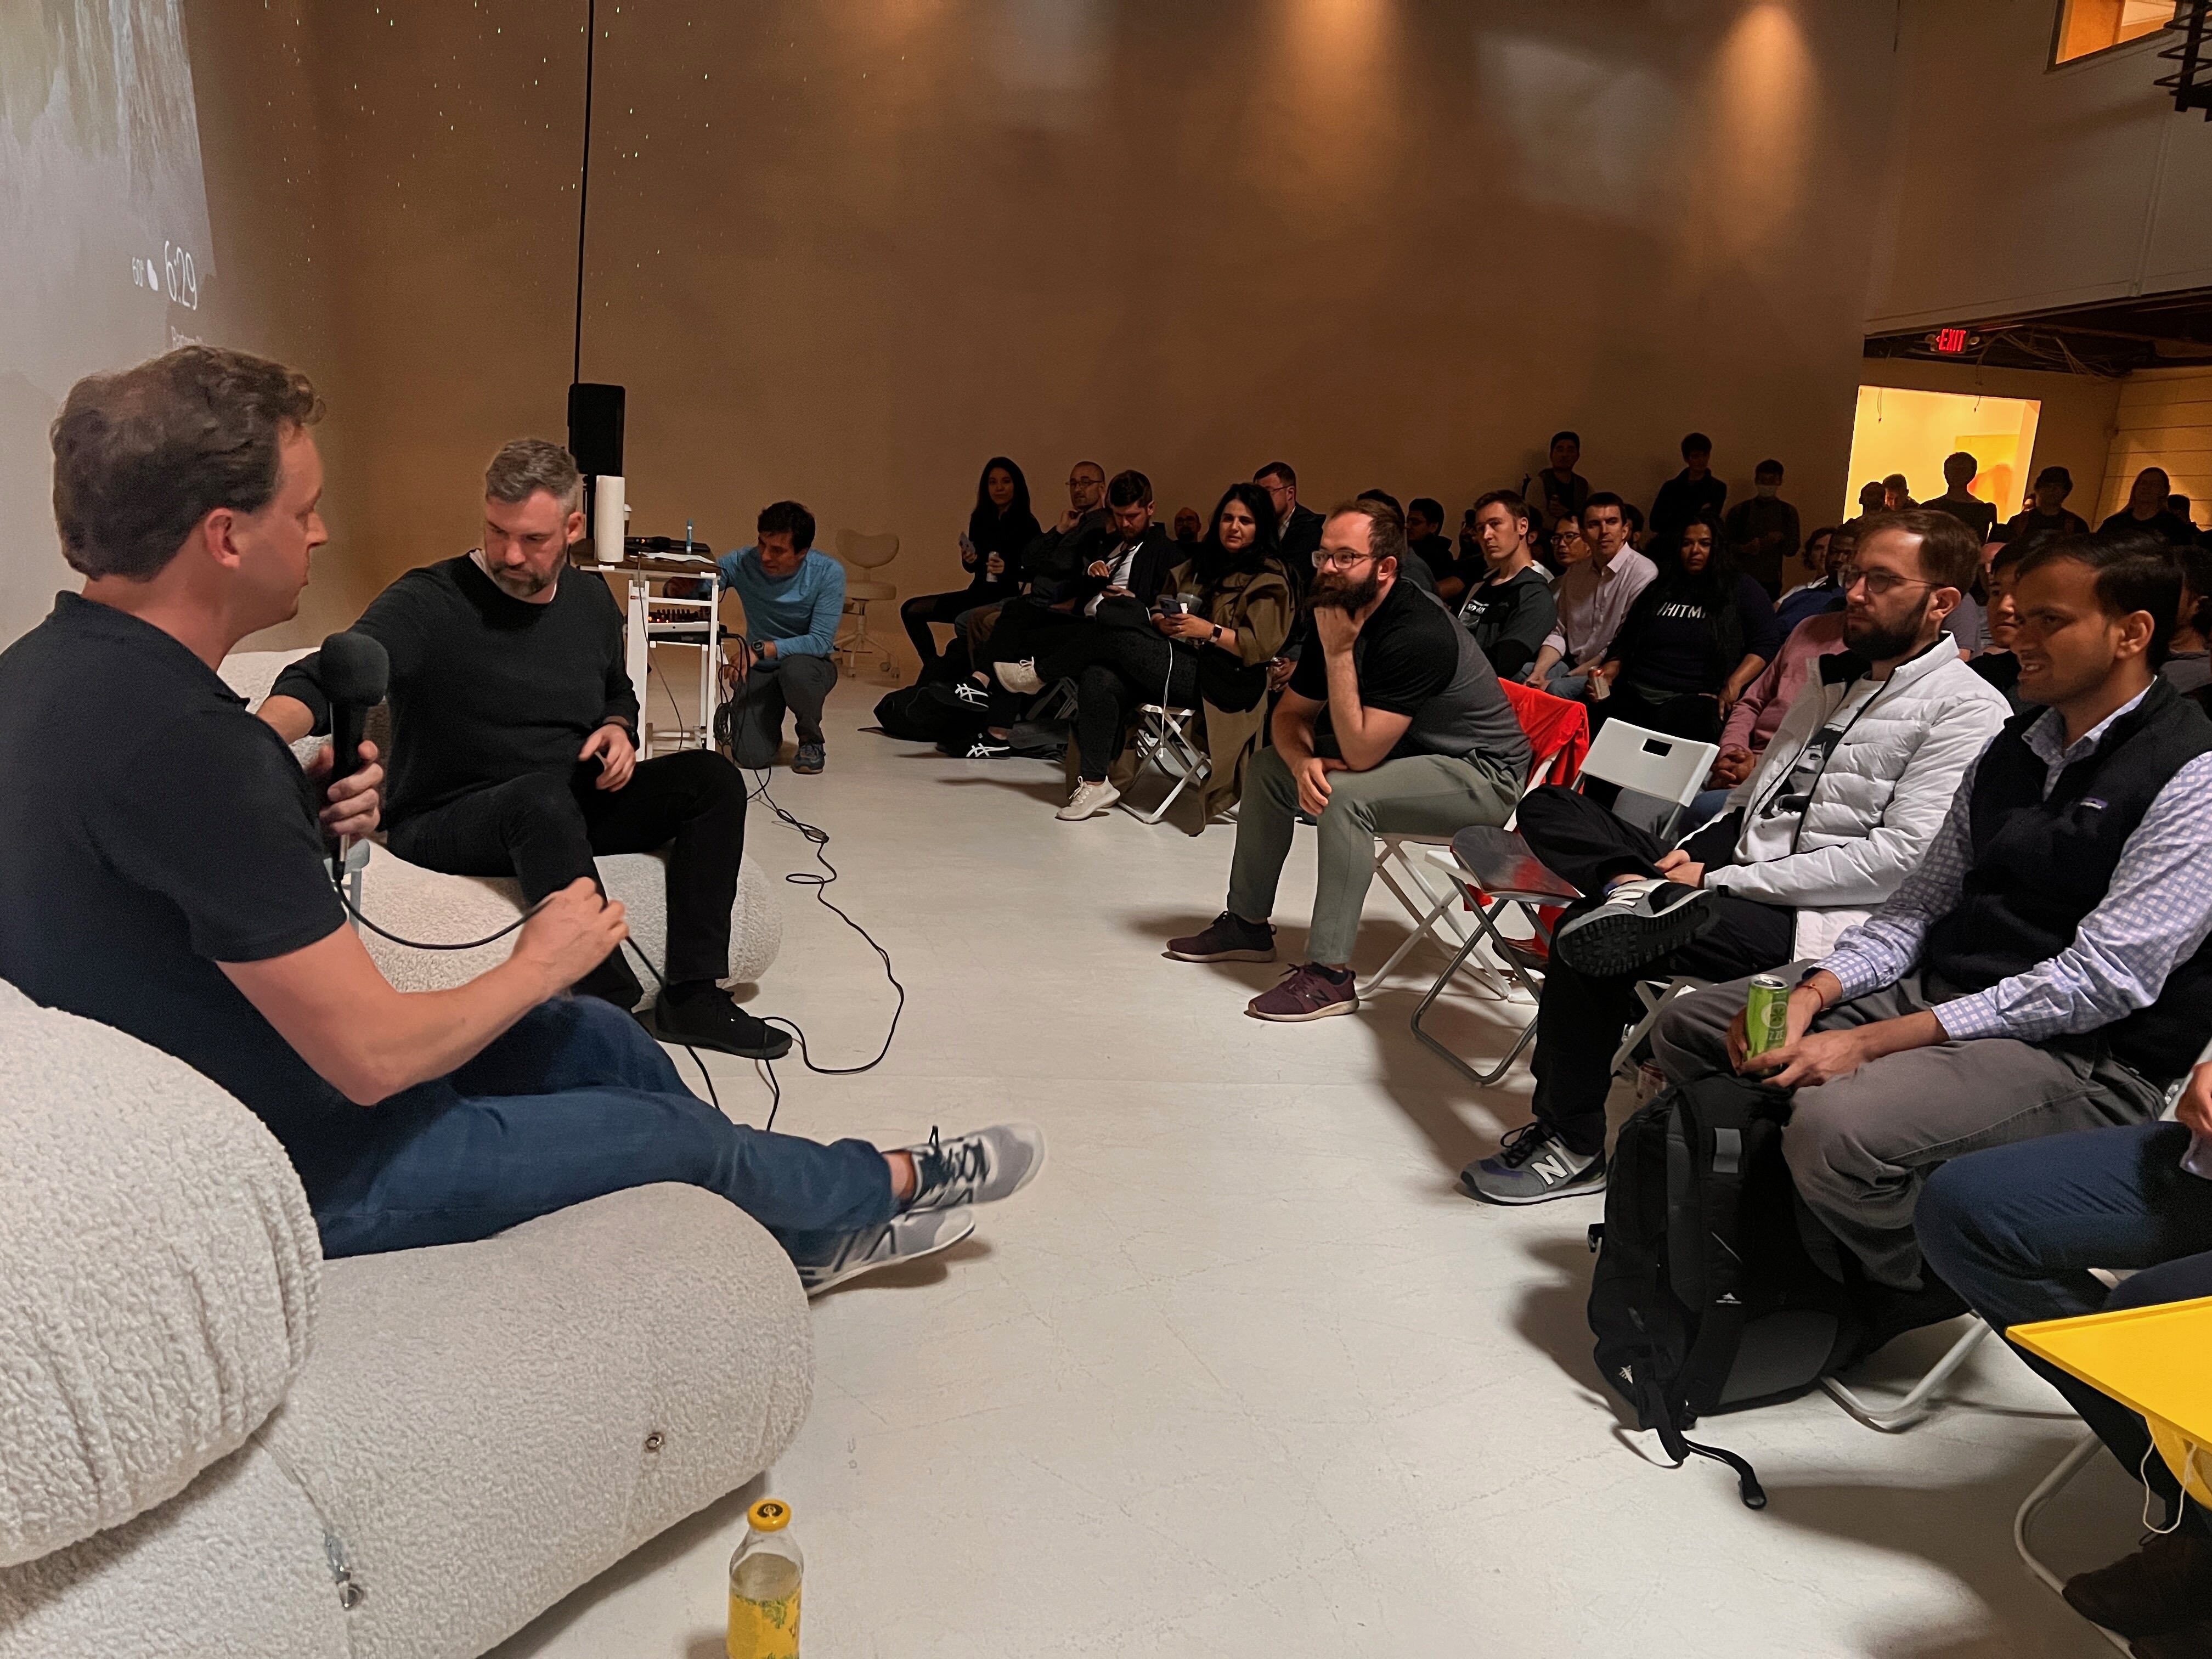
ResolveML
Pairing: Docker
ibaAgent: Agentic time-series analysis.
Pairing: LangChain
ibaAgent: Agentic time-series analysis.
Pairing: Langfuse
ibaAgent: Agentic time-series analysis.
Pairing: LangGraph
ibaAgent: Agentic time-series analysis.
Recent Talks & Demos
Showing 1-2 of 2
